These release notes describe new features, update recommendations, known issues, and other information related the Cleo Dashboards v3.3.2 release.
How to update to the current release
Product enhancements and fixes to existing functionality are made available on the Cleo Support Portal, which allows you to download the latest updates without contacting Support or your Customer Account Manager. The information below describes how to download and apply these updates to your Cleo Dashboards.
- Obtain a downloadable product update for Dashboards from the Cleo Support Portal.
- Select the correct update, which is available as either a Linux .bin file or a Windows executable.
Note: Before proceeding, the following prerequisites must be met:
- The Dashboard Server must be stopped.
- Administrative access to the existing Dashboard install location is required.
- (For Windows) Run the update executable and follow the instructions of the installer to complete the update process.
(For Linux) Open a terminal session with admin/root level permissions, navigate to and run the update binary file. Follow the instructions of the installer to complete the update process.
This completes the update process.
For more information related to fresh installs and the updates, please refer to the Getting Started with the Cleo Dashboards install guide, available from the Support Portal on www.cleo.com.
Contact Technical Support at +1 815-282-7894 or 1-866-444-CLEO (2536) if you require any assistance.
What’s new in this current release
The following information summarizes major enhancements and changes to this current version of the Cleo Dashboards.
Data Source now supports HTTPS in the Web Service URL parameter
Dashboard now supports the Hyper Text Transfer Protocol (HTTP). When configuring a Data source, the https parameter can be used in the Web Service URL field.
Refer to the Managing Data Sources in the Cleo Dashboards User Guide/Getting Started guide for more information.
All existing known issues and workarounds remain the same.
Previous releases
The features and enhancements listed below pertain to previous Cleo Dashboards releases.
- The Self-Service feature, used to design custom reports, is supported on MS SQL database.
- Tomcat has been upgraded to version 7.0.85
Fixed Issues (v3.3.1)
The following defects have been fixed in this release.
- (D-04757) Remove Default Error Pages: This issue is fixed. A custom Dashboard error page now displays for the errors instead of the default Tomcat error page.
- (D-04758) Change Server Header: This issue is fixed. The Tomcat server header details were being printed. This has now been removed.
- (D-04762) Tomcat-users.xml passwords in plaintext: This issue is fixed. The Tomcat-users.xml the passwords are now encrypted.
- (D-04754) Hello Servlet at base URL: This issue is fixed. The base url has been removed.
- (D-04755) tomcat /docs/ and /examples/ exposed: This issue is fixed. The Tomcat documentation and examples have been removed.
- (D-04759) *NIX Permissions excessive: This issue is fixed. The file permission for “others” has been restricted to only read and write. Execute permission has been removed.
Known Issues with workarounds
(R-02573): Need a filter screen for Transfers page (instead of showing all data)
The Cleo Dashboards now allow you to disable a report from automatically displaying data upon page load. Once configured, users who access the report will be presented with the Filter page first. To actually view the data, the user just needs to enter a selection and then press Filter button.
To enable this feature, go to the directory:
mrc\production\m-power\mrcjava\WEB-INF\classes\CIS\I05101p.xml
and search for the property data_on_load
- By default, this option is set to "Always display data" with value “0”.
<data_on_load pdesc="data_on_load" value="0"/>
- However, if you would like the page to initially load without any data, change value to “1”.
<data_on_load pdesc="data_on_load" value="1"/>
Once done, save the file, and restart the Dashboard.
(R-02568): Scheduler tasks are sending duplicate emails
The following steps will help resolve the issue of the Scheduler sending two emails for a configured schedule:
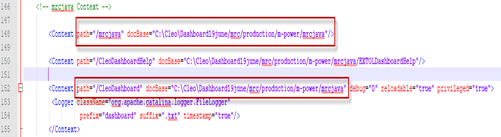
- In \mrc\production\m-power\tomcat\conf\server.xml there two context paths:
/mrcjava
/CleoDashboard
...that both point to the same mrcjava installation folder.
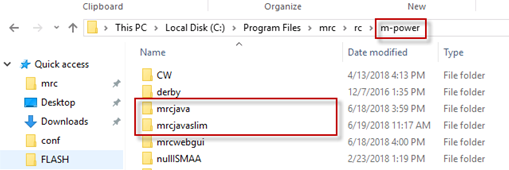
- Create a new folder at the same level as mrcjava and name it mrcjavaslim
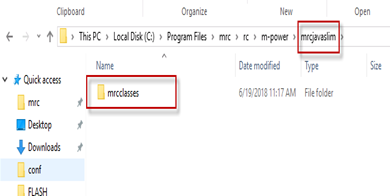
- Copy the mrcclasses folder from the mrcjava folder to this newly created mrcjavaslim
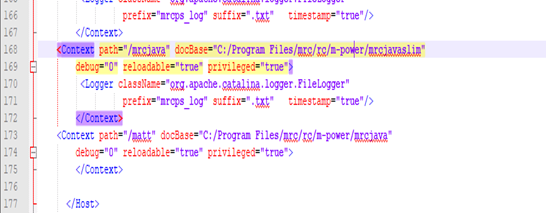
In the xml file, change the /mrcjava context to point to the new mrcjavaslim folder (instead of the mrcjava folder).
Result: This should resolve the issue of two emails being delivered from the Scheduler.
Custom reports and dashboards can be designed with Self-Service feature (v3.3)
The Cleo Dashboard’s new Self Service feature gives you the ability to easily create, design, and share custom reports based on your data. Access your data based on the supplied Cleo datasets and have the ability to control numerous aspects of custom reports.
- Format your report with a variety of tools such as Data Search, Data Search with Totals, Pivot Table, and Graphing Visualization
- Control the placement, sequence, and order of selected columns in your reports
- Filter data quickly and see instant results
- Export data to Excel with the push of a button
- Add calculations
- Save and share your custom designs
- Create new Dashboards or export your designs to existing Dashboards
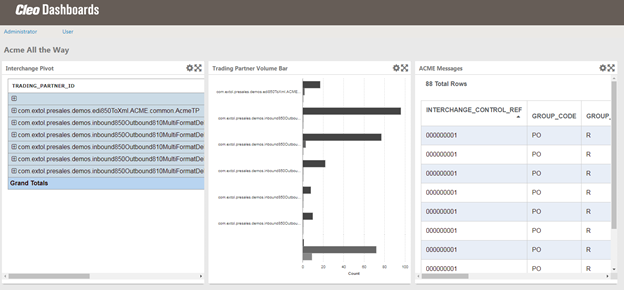
An example of a custom Dashboard with three different reports
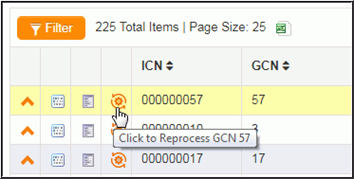
Transactions reprocessed directly from reports (v3.3)
Reprocessing allows transactions to be processed again, even after they have been initially processed and logged. Reprocessing can occur at the Connection, Interchange, and Message log levels. This takes place when a transaction fails and is then corrected.
Reprocessing is particularly useful when an interchange may have had one of its messages fail, but other messages successfully processed. In this case, that message can be reprocessed after a fix has been applied, and prevents other messages in the interchange from being reprocessed.
To reprocess, just click the button for the record to be reprocessed. Doing so sends the reprocess request to your Clarify server.
Refer to the Reprocessing Records in the Cleo Dashboards User Guide for more information.
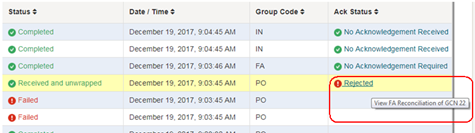
Functional Acknowledgment details viewed directly from reports (v3.3)
You can now access FA Reconciliation reports directly from Group or Message reports by clicking a link under the Ack Status column.
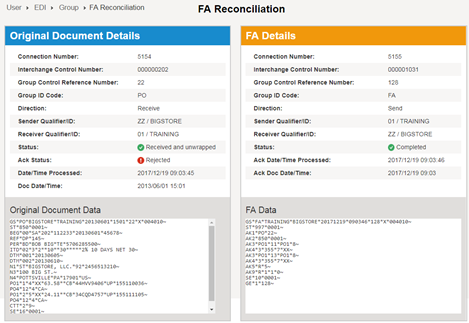
The FA Reconciliation report, shown below, has two sections.
- Original Document Details: Displays original document details and data for the selected record.
- FA Details: Displays FA details and data for the selected record.
This convenient view of the original document, along with its associated Functional Acknowledgement, now simplifies the process to find this information, and replaces the previous process that required navigating through multiple reports.
Enhanced Trading Partner report (v3.3)
The Trading Partner report (along with specific Trading Partner Details reports), has been enhanced to provide trading partner details based on message direction, activity for a specified period, and totals across all trading partners.
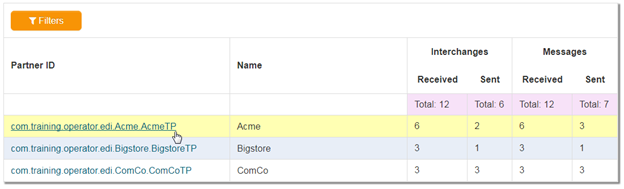
A Trading Partners Details report, available through a link in the Partner ID column shown above, also includes message id, direction, and totals for one selected trading partner.
Cleo Dashboard works with improved Clarify Server Cluster environment (v3.2.2)
As part of the improved Server Cluster architecture offered in the Cleo Clarify v4.11 release, the Cleo Dashboards can be configured for broader static and interactive reporting across an entire Cleo Clarify Server Cluster environment. Cluster Server Node status can be viewed from the System Health Dashboard report.
To configure the Dashboard v3.2.2 to work with Clarify v4.11, simply configure your data source to connect to Server Cluster environments. Before completing these, make sure the Server Cluster has been started.
- Go to the Manage Data Source
- Select the Update Record icon to open the data source record.
- In the Web Service URL field, provide the url for each Server in the Cluster. Doing so provides effective failover protection.
In the example below, there are three server nodes listed:
http://<test server 1>:8500,http://<test server 2>:8500,http://<test server 3>:8500
Note: <server> can be defined with IP or hostname.
- Restart the Dashboard Server.
Other changes
- The Late Acknowledgement report can now be scheduled.
- The report Scheduler now makes more available parameters for CIS and Cleo EEI reports.
- Breadcrumb navigation has been added to the Dashboard for better visual aid.
Broader Database Support – Oracle and MS SQL (for Harmony reports only) (v3.2.1)
Cleo Dashboards now support Harmony reports that are using Oracle and MS SQL Server data sources. These different data types can be selected with the Manage Data Source option.
Please also see Configuring the Dashboards for Oracle and MS SQL data sources on page 11 for more information.
Enhanced Security (v3.2.1)
The HTTPS protocol is now supported. Steps to enable HTTPS can be found in the Product Help and in Getting Started with the Cleo Dashboards install guide.
Sign-in URL path has changed (v3.2.1)
The URL path needed for sign in has changed slightly. Please make notes of this change, and update any bookmarks for previous versions of the Cleo Dashboard. The changes are listed below.
http://<server>/CleoDashboard/CIS.Login has changed to http://<server>/CleoDashboard/servlet/CIS.Login
http://<server>/CleoDashboard/EEI.Login has changed to http://<server>/CleoDashboard/servlet/EEI.Login
http://<server>/CleoDashboard/EBI4.Login has changed to http://<server>/CleoDashboard/servlet/EBI4.Login
This information is also available in the Getting Started with the Cleo Dashboards install guide.
Configuring the Dashboards for Oracle and MS SQL data sources
The Harmony reports in Cleo Dashboards now support Oracle and MS SQL Server data sources. The data source type can be selected when configuring the data source from Manage Data Source option.
Please note these two topics:
- Required configuration – Data Source ID prefixes (known issue)
- JDBC Drivers for MS SQL and Oracle
Required configuration – Data Source ID prefixes
When configuring your data source, the Data Source ID name should be prefixed with postgresql, ms_sqlserver, or oracle. See examples below.
For Postgres: postgresql Example: postgresql_CIS
For MS SQL: ms_sqlserver Example: ms_sqlserver1
For Oracle: oracle Example: oracleDataSource
JDBC Drivers for MS SQL and Oracle
The Cleo Dashboards are not bundled with the MS SQL server JDBC driver jar file. If your Dashboard needs to be configured for connecting to MS SQL Server, then download the driver jar file from the Microsoft website and copy it to this location: <Dashboard Installer>/mrc/production/m-power/tomcat/lib.
The Cleo Dashboards are pre-bundled with an Oracle JDBC driver ojdbc14.jar. This allows Dashboard to connect to Oracle 11g and below. If you need to connect to later versions of Oracle, please delete the ojdbc14.jar file from the <Dashboard Installer>/mrc/production/m-power/tomcat/lib location and download the compatible version of JDBC driver from Oracle’s website. Copy it to <Dashboard Installer>/mrc/production/m-power/tomcat/lib.
The features and enhancements listed below pertain to the previous Cleo Dashboards release (v3.2 released June 2017).
Consolidated Platform (v3.2)
The Clarify and Harmony reports have been consolidated into one single platform. Users can access all reports and have full visibility into both the Clarify and Harmony transactions from one single platform.
Integrated Dashboard and Reporting (v3.2)
Integrated Dashboard reports mean that you can monitor the status of a transaction no matter where it started or where it may be going. These reports provide out of the box, real-time visibility into data transaction across both Harmony and Clarify.
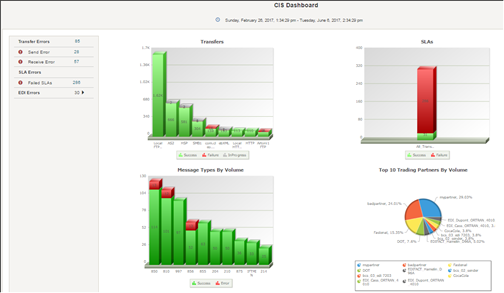
Dashboard reports are high-level, comprehensive reports that can be used as the primary reporting portal to view, manage, sort and export other reports. Two new Dashboard reports provide views into both data transfers and EDI transactions – CIS Dashboard and Transfers Dashboard.
CIS Dashboard: This dashboard report graphically summarizes transfers which occurred through both Harmony and Clarify. These reports provide a summary of your top trading partners.
Transfers Dashboard: This dashboard report graphically summarizes success of transfers and SLAs for each trading partner and provides drill-down access to more detailed information about transfers and SLAs on a per-partner basis.
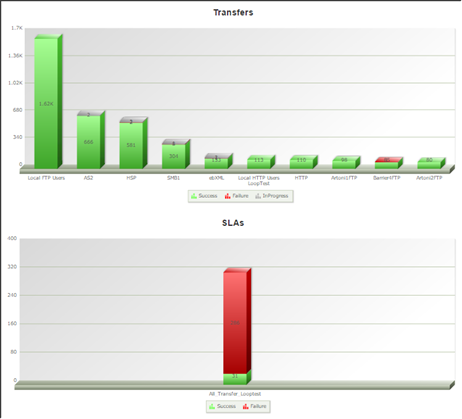
Both dashboards allow you to choose values for certain parameters, thereby helping to control the scope of the data included in the report.
Data Transfer Reports available (v3.2)
In addition to the Clarify reports that have been available in earlier versions of the Cleo Dashboards, new Data Transfer reports are available. These reports provide information about file transfers, movement, and related activities. Some have the ability to move between related reports through drill-down functionality as well as filtering. Descriptions for all reports are provided below.
- SLA Report: A report displaying a list of all checkpoints for the current SLA.
- SLA Summary: An interactive report summarizing the checkpoints for each trading partner.
- Transfer: A report displaying a list of all transfers that have occurred in the Cleo Harmony and Cleo Clarify system.
- Transfer Summary: An interactive report summarizing success of transfers for each trading partner.
Other changes (v3.2)
- The EDI Transaction Status Dashboard report is now called the EDI Dashboard report.
- The Operations Dashboard report is now called the System Health Dashboard report.
- A notification message now appears directly in the Dashboard to notify you when your temporary license has expired.
- Viewing dashboard reports on mobile devices is not supported with this version.
For more information on the above information, please contact your Customer Account Manager.
For more in-depth instructions on setting up and using the Cleo Dashboards, please refer to the following Help content:
- Getting Started with the Cleo Dashboards
- Cleo Dashboards User Guide (part of the product online help)
Known issues
Please review the following known issues for this current Dashboard release. Steps to fix or manage the issue are provided in some cases.
Note: The following issues existed before this current release.
Existing Data Sources not working after update
As a result of updating to v3.3, existing data sources will no longer work; they will have to re-created and re-configured.
Steps
- From the Manage Data Source screen, use the Copy Record button to create a new version of each data source.
- For each data source, use a new data source id, but still based on standard naming conventions (See information on Required configuration – Data Source ID prefixes on page 11.
- Reconfigure your data source as required. Please refer to steps described in the Initial Post-Install Configuration steps in the can be found in the Product Help and in Getting Started with the Cleo Dashboards install guide.
- Delete the old data source(s).
- Restart the Dashboard server.
If you encounter an SAXParse exception, take these steps to resolve:
- Open the mrc-spring-context.xml file, which can be found in the Dashboards install directory\mrc\production\m-power\mrcjava\WEB-INF\classes
- Look for the line number with the exception message;, go to that line number and remove the content within the <bean> tag(<bean>...........</bean>).
|
<bean abstract="false" autowire="default" class="com.mrc.dbo.EncryptionDataSource" dependency-check="default" id="CIS" lazy-init="true" singleton="true"> <property name="password"> <value>aT5/rUto6V7gc+LSgM/iwIgQQn9pCy0ojqPJz1+o5P0=</value> </property> <property name="username"> <value>postgres</value></property> <property name="url"> <value>jdbc:postgresql://localhost:5432/postgres</value> </property> <property name="driverClassName"> <value>org.postgresql.Driver</value> </property> </bean>
|
For example:
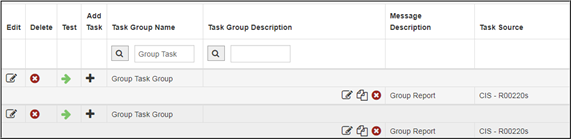
Update is causing duplicate task groups in Scheduler
Duplicate tasks groups are appearing in the Scheduler’s Messaging and Scheduled Tasks option after an update. If a task group is scheduled, it will execute twice, resulting in two messages instead of one. The duplicate must be removed to prevent this from occurring. Take these steps to remove the duplicate:
- From Messaging and Scheduled Tasks, locate all duplicate tasks groups (they will have same name). Tip: Use Search to isolate the duplicates, as shown here.
- Delete one of the entries, depending on which scenario applies:
- If you haven’t made any customizations to any task and message groups, or have not scheduled any tasks, then delete either one.
- If you have customized any task and message groups (including scheduled tasks), then you don’t want to delete that one. Delete the default duplicate.
- The difference between the two entries may be visible from one of the Task and Message Groups columns (for example, Task Type for one might be the default Email-HTML, while the other is the one you customized to be Email – Excel.
- If the difference is not visible, then use the Edit button to view additional message definitions (message type, message format, recipients, and message text) to distinguish the customized version from the default duplicate. For example: if you configured the Message Text definition to include a Sender and Message Subject, the default duplicate would not contain this information (and would be blank).
IE Web Browser issues
Certain report functionality and rendering are not working correctly when using Internet Explorer as your Web browser.
Workaround: Use Firefox or Chrome Web Browsers to view Dashboard reports.
Scheduler: PDF Output format not working for Windows Server versions
When delivering scheduled reports from the Scheduler, selecting PDF as the output format is currently not supported on any Win2k series. This output format is selected in the Messaging and Scheduled Tasks\Task and Message Groups\Message Format screen.
“Send Link via Email” not working correctly in Self Service
When sharing a design from the Self Service feature, the option to Send Link via Email is not working correctly as it generates in incorrect link.
Workaround: Instead, use the Copy Link option to copy the generated link to your clipboard, and then paste it into the Message box of the generated email, as shown here.
Existing Data Sources may need to be reconfigured
After upgrading to v3.2.1 (from either 3.1 or 3.1.2), an error may occur when trying to access reports using a data source that was configured prior to the update.
To fix this issue (reconfigure data source):
- With Administrator privileges, select DataSource > Manage Data Source.
- Select the Update Record option for the specific data source.
- Click Accept at the bottom of the editor.
- Restart the Dashboard server.
Existing Scheduled Tasks may need to be reconfigured
After upgrading to v3.2.1 (from either 3.1 or 3.1.2), any Scheduled Task that was configured prior to the update may not run.
To fix this issue (resave the Schedule):
- Open the Scheduled Task from the Messaging and Scheduled Tasks
- Select the Edit Message option for the selected task.
- Save the task (and return to Scheduled Tasks).
- Restart the Dashboard server.
Existing Scheduled Tasks with Email delivery may need to be reconfigured
After upgrading to v3.2.1 (from either 3.1 or 3.1.2), any Scheduled Task with email as the delivery option that was configured prior to the update may not work. This is due to SMTP server details (in a messaging.properties file) being overwritten after the upgrade.
To fix this issue:
- Locate and open the messaging.properties file. This is found in: <DashboardInstallation>\mrc\production\m-power\mrcjava\job_streams
- Specify the necessary values for the SMTP server.
- Restart the Dashboard server.
Data Source ID prefixes are required
When configuring the data source from the Manage Data Source option, the Data Source ID value is dependent on the Data Type being configured. Currently, the Data Source ID name should be prefixed with postgresql, ms_sqlserver, or oracle.
Please see Configuring the Dashboards for Oracle and MS SQL data sources on page 11 for more information.
Additional Parameters not being used in Message Definition (and Scheduled Tasks)
When configuring a Scheduled Task Message and passing the dataSource parameter into the optional Additional Parameters section, the parameter is not being used when the task runs.
To fix this issue:
- Locate and open the xml file. This is found in <Installation>/mrc/production/m-power/mrcjava/WEB_INF/classes/CIS
- Change the value of the data source parameter to the appropriate data source.
Compatible Cleo Products
Please be aware of following compatibility between the different Cleo products and this current Dashboard release.
Cleo Clarify
- Clarify 4.16 Server requires Dashboards v3.3.2 for full compatibility; the Dashboard v3.3.2 will also support previous versions of Clarify v4.
- 2.2 is the minimum required version for use with a Server Cluster (v4.11 to v4.15).
- 2 is the minimum required version for use with a Single Server.
Cleo Harmony or Cleo VLTrader
- Recommended: 5
- Minimum: v5.4.1
Cleo EEI
- Recommended: 1
- Minimum: v6.5
Comments
0 comments
Please sign in to leave a comment.